Legislative Dashboards
Legislative Community Health Dashboards
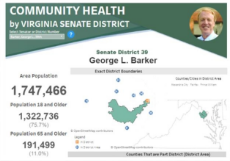
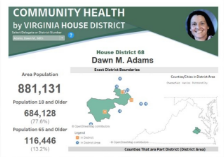
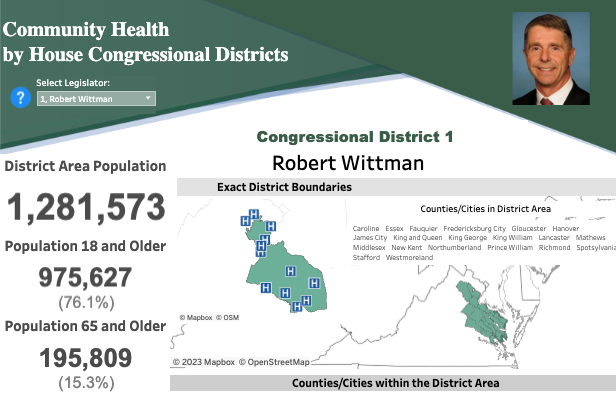
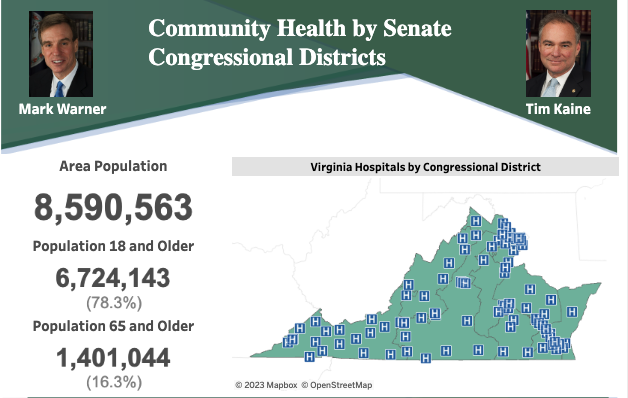
VHHA’s research team has created Community Health Legislative Dashboards with key statistics corresponding to legislative areas. Statistics provided cover demographic and population data, health indicators, local hospital listings, and more. These dashboards are grouped by Senate District and House District.
If you don’t know who your legislator is, you can find out here.


Populate Your Dashboard
To operate the dashboard, simply choose a legislator at the top of the page. Community health statistics corresponding to a legislative area will then automatically populate the dashboard. Hover the cursor over each metric for details about that statistic, such as definitions, source citations, and the applicable time frame for that statistic.
Print and Share Your Dashboard
- To print a dashboard, click “Download” at the bottom of the page, and choose a file format for exporting (PDF or Image).
- To share a dashboard by e-mail, click “Share” and copy the link provided into an e-mail message.
- To share a dashboard on social media, click “Share” and choose the platform for sharing (Facebook or Twitter).